
Use Results to monitor survey progress, explore responses by question or participant, filter the data, and export reports.
In this article:- Review the Results overview
- Review the question breakdown
- Analyze individual questions
- Customize columns and filters
- Segment by distribution
- Review participant details
- Print and export results
Open a survey and select Results. The Overview tab opens by default and summarizes:
- Total responses
- Total participants
- Completion rate
- Average completion time
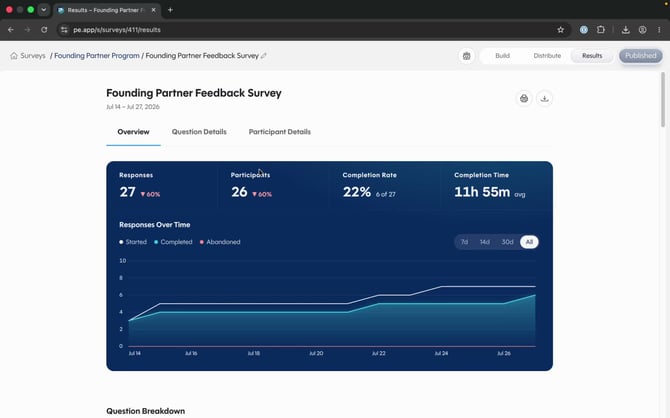
The Overview tab provides survey-level metrics and response trends.
Adjust the reporting period
Use 7d, 14d, 30d, or All to change the reporting period. Hover over a data point to see the date and exact counts for responses that were started, completed, or abandoned.
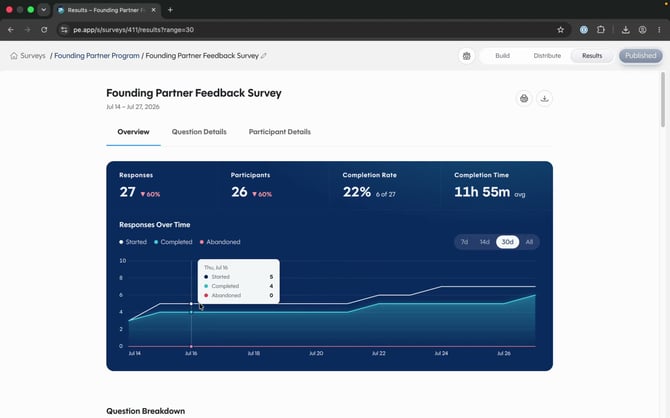 Hover over the chart to inspect response activity for a specific date.
Scroll below the overview chart to see a live summary for each question. Survey Everywhere uses a visualization suited to the question type, including hierarchical bars for drill-down questions and charts for choice or scale questions.
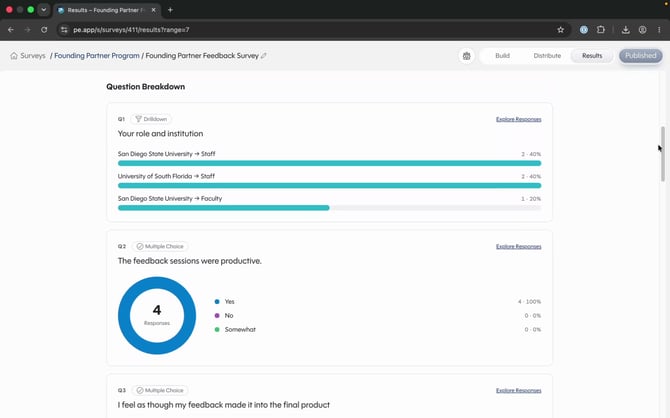 Each question card summarizes the response distribution and links to detailed analysis.
Multiple-choice questions use charts and percentages. Short- and long-text questions display as many individual responses as space allows. Scale questions use segmented bars to show the percentage for each value.
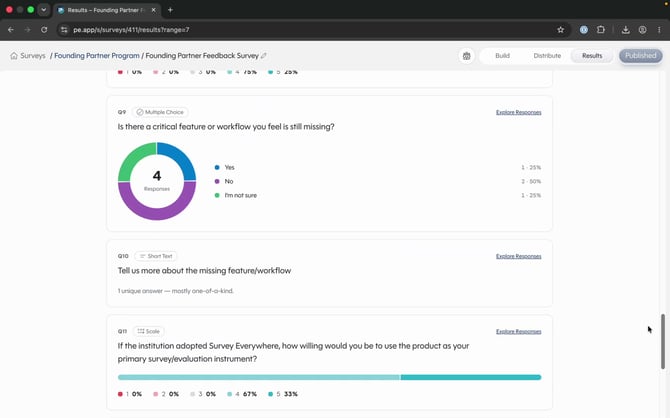 Question summaries adapt to the type of response being analyzed.
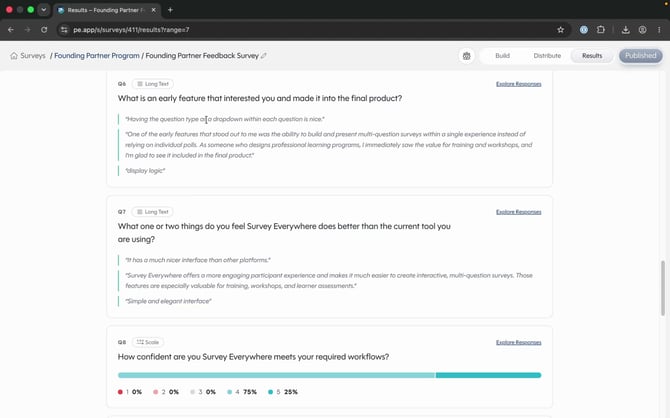 Text question summaries display a selection of individual responses.
Open Question Details or select Explore Responses on a summary card. Choose a question to analyze its chart and response split.
- Choose a specific survey version or select All Versions.
- Use Split by to compare responses using identifiers or detailed participant information.
- Use the distribution menu to include all distributions or select a specific source.
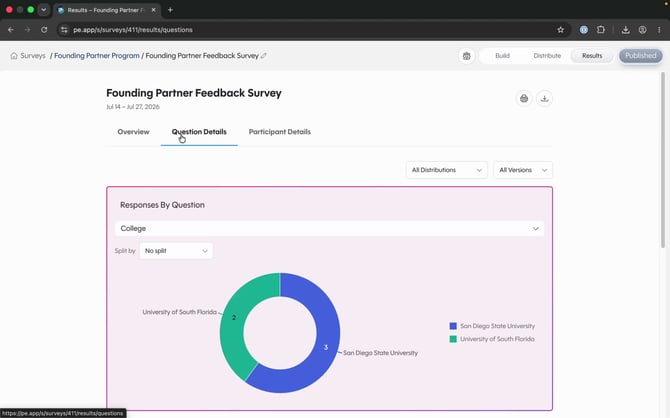 Select a question, version, distribution, and split to focus the analysis.
Review the raw data
Scroll below the question chart to review individual response rows. The table can include the question, response, received timestamp, correctness, and participant identity when available.
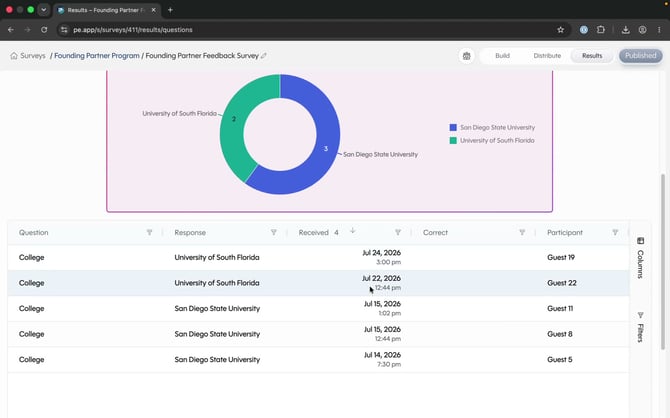 Use the raw table to inspect and sort individual responses.
Choose table columns
Open Columns beside the raw table. Select the fields to display, clear fields you do not need, search for a column, or drag fields into a different order.
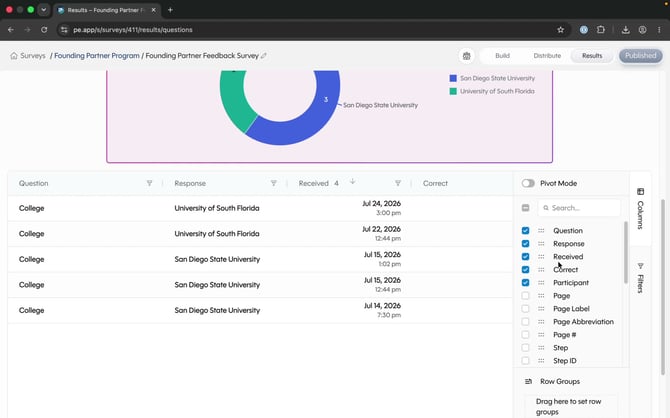 Include only the fields needed for the current analysis or export.
Filter the data
Open Filters to limit the rows included in the table and export. Select Add Filter to create another condition, or edit an existing condition such as survey version.
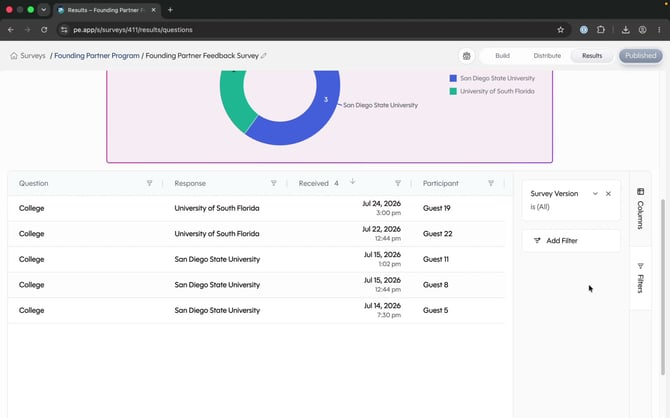 Filters narrow the analysis without changing the collected response data.
Open All Distributions to analyze all response sources together or select one distribution. Distribution options can include web links, survey previews, and learning management system assignments.
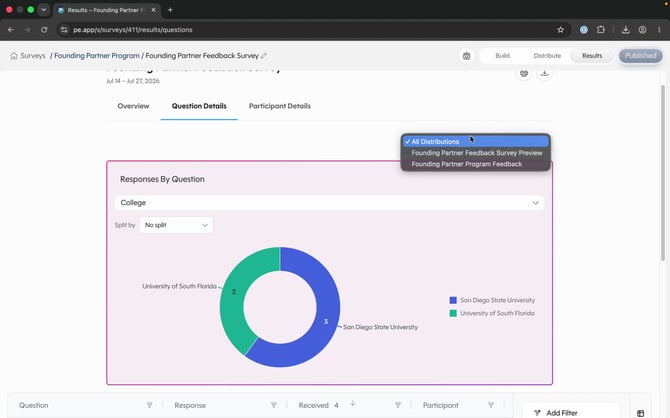 Select a distribution to isolate responses collected through that source.
Open Participant Details to analyze survey attempts over time. Choose between:
- All Attempts for every started, completed, and abandoned attempt
- Unique Participants to group all attempts for each participant
Scroll below the chart to inspect the participant-level raw data, then sort or filter the table as needed.
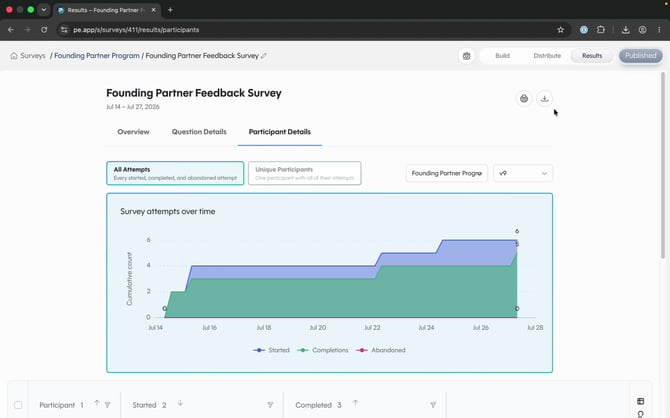 Participant Details tracks attempts, completions, and abandoned responses over time.
Print or save the summary as PDF
Select the print button to open the browser’s print window. Choose Save as PDF to create a PDF copy of the current results report.
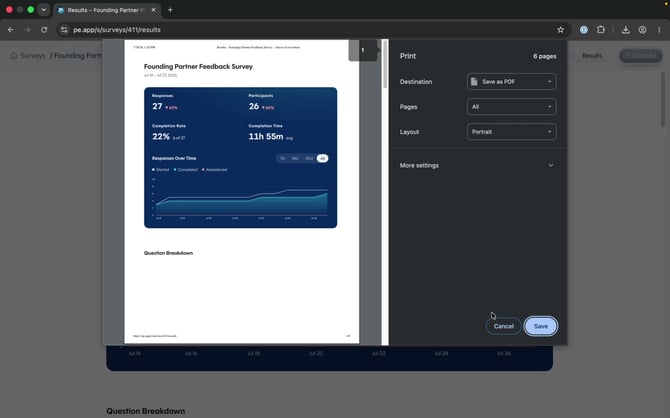 Use the print window to print the report or save it as a PDF.
Export response data
Select the download button and choose the output needed for your analysis:
- Export with filters: CSV or Excel
- Export all data: CSV, Excel, SPSS, or R
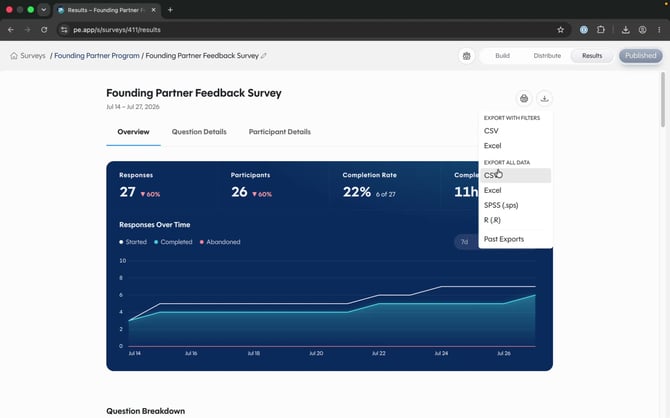
Export the filtered view or the complete survey data in your preferred format.
Note: Confirm the selected version, distribution, split, columns, and filters before exporting.